Charts are popular and can help to visualize the data in a WinForm application. This tutorial will focus on how to create and bind charts using C# and Linq.
To better understand this tutorial, you should know the following C# programming area:
Here are the steps to proceed with the tutorial:
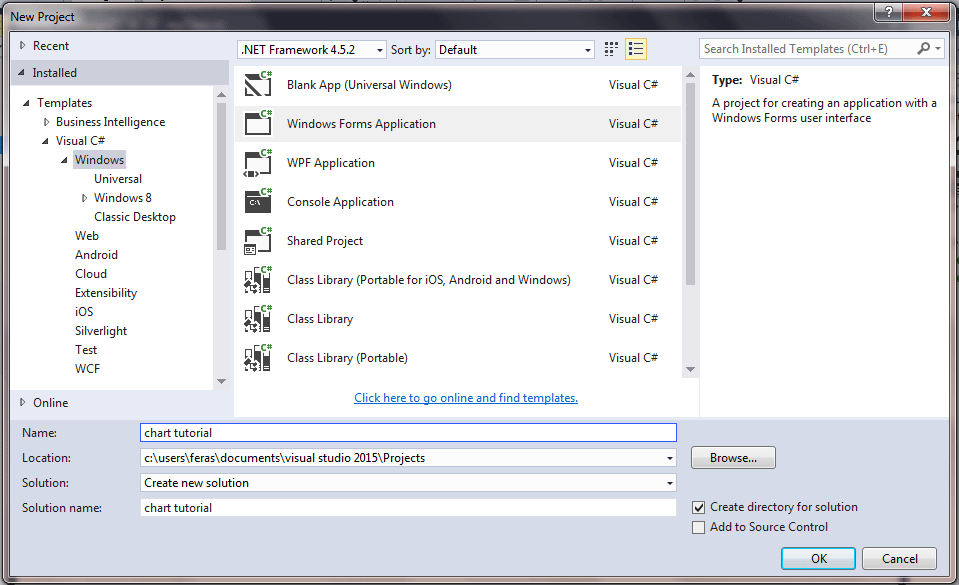
1- Create a WinForm application using C#

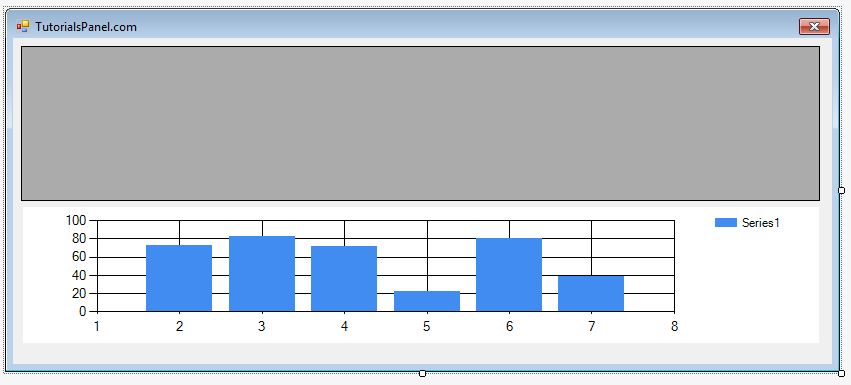
2 – Add a DataGridView and a Chart to the main form as shown below. Both controls can be found under the Data Tab in the Toolbox.

3 – Bind the DataGridView with data from a DataTable
DataTable dt = new DataTable();
      void bindGrid()
      {

          int i;
          object[] array = new object[3];
          dt.Columns.Add("ID");
          dt.Columns.Add("Name");
          dt.Columns.Add("Department");
          dt.Columns.Add("Job title");

          dt.Rows.Add(1, "Steve", "IT", "IT Specialist");
          dt.Rows.Add(2, "Russ", "Engineering", "Software Engineer");
          dt.Rows.Add(3, "Ron", "IT", "Data Scientist");
          dt.Rows.Add(4, "Peter", "IT", "Programmer");
          dt.Rows.Add(5, "Jasone", "IT", "Programmer");
          dt.Rows.Add(6, "Ken", "Administration", "HR Specialist");

          gv.DataSource = dt;
      }
4 – Bind the chart with data from the same DataTable as above. Don’t forget to add the Namespace DataVisualization.Charting as well.
void bindChart()
{
    string[] seriesArray = dt.AsEnumerable().Select(r => r.Field("Department")).Distinct().ToArray();
    // Set palette.
    this.chart1.Palette = System.Windows.Forms.DataVisualization.Charting.ChartColorPalette.SemiTransparent;
    // Set title.
    this.chart1.Titles.Add("Number of employees per Department");
    // Add series.
    for (int i = 0; i < seriesArray.Length; i++)
    {
        Series series = this.chart1.Series.Add(seriesArray[i]);
        int count = (from DataRow row in dt.Rows where (string)row["Department"] == seriesArray[i] select row).Count();
        series.Points.Add(count);
    }
}
5 – Call the methods bindGrid() and bindChart() from the Page Load Event method
private void frm_Load(object sender, EventArgs e)
{
    try
    {
        bindGrid();
        bindChart();
    }
    catch (Exception ex)
    { MessageBox.Show(ex.Message); }
}
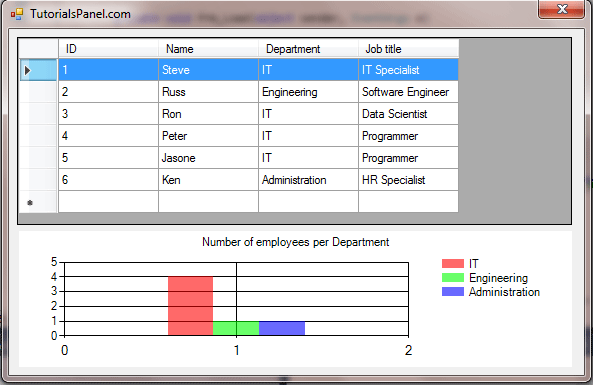
6 – Run the application


Comments
Thanks for this tutorial!