
In this article, we are going to talk about the chart controls in VB.NET and how it can be bound with data using LINQ. As we all know, charts are used to interpret the data in a more understandable way, where everyone can easily grasp the information that we are representing.
Bing a chart control using VB.NET
To get started, first, we need to create a new Windows Application project in VB.NET and a new Form to it.
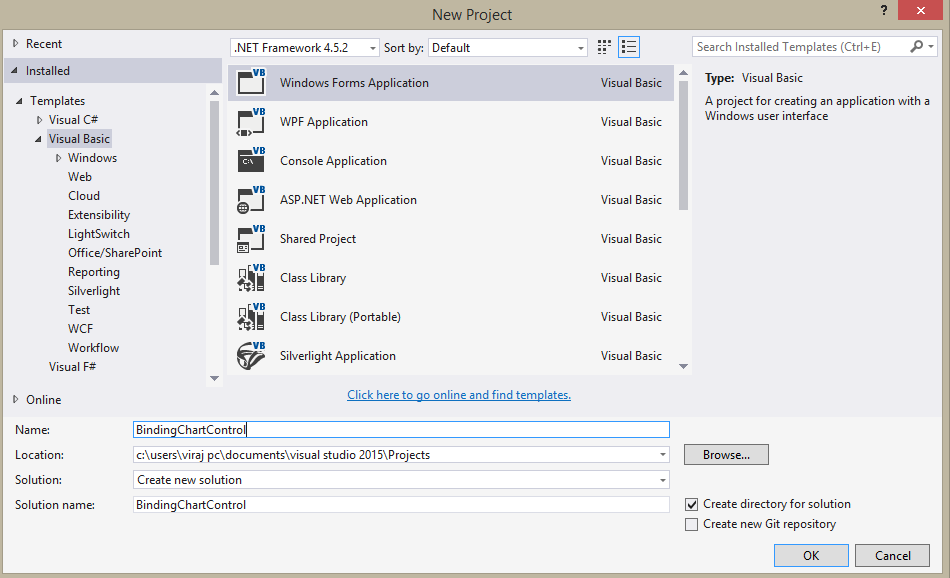
Create a New WinForm Project
Next, from the toolbox, drag and drop a new chart as shown below. As you want, you can change the properties of the chart (Color, size, type, and name) from the properties tab. But in this example, we are not going to focus on those parts, as we only focus in, binding the data to the chart control.
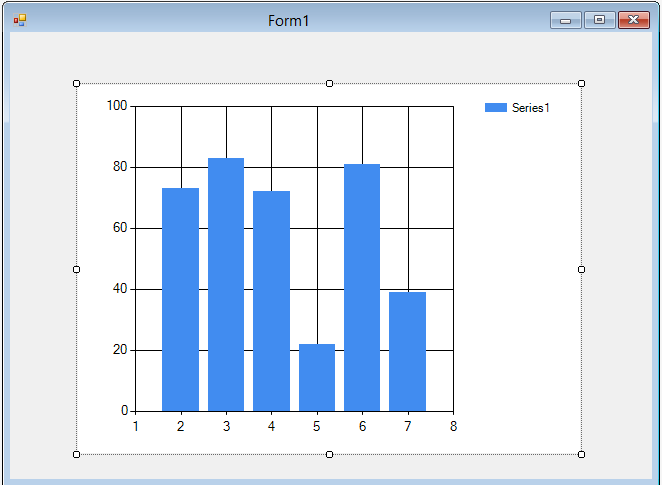
Add a Chart Control
To display the data in the chart view, we need to fetch it from the database. For that, we will be using SQL Server database and will use the converted query from the SQL into the LINQ. To connect any existing database to our program, first, we need to add a LinqToSql class to the application. After adding the particular class, we can create a new connection as given below.
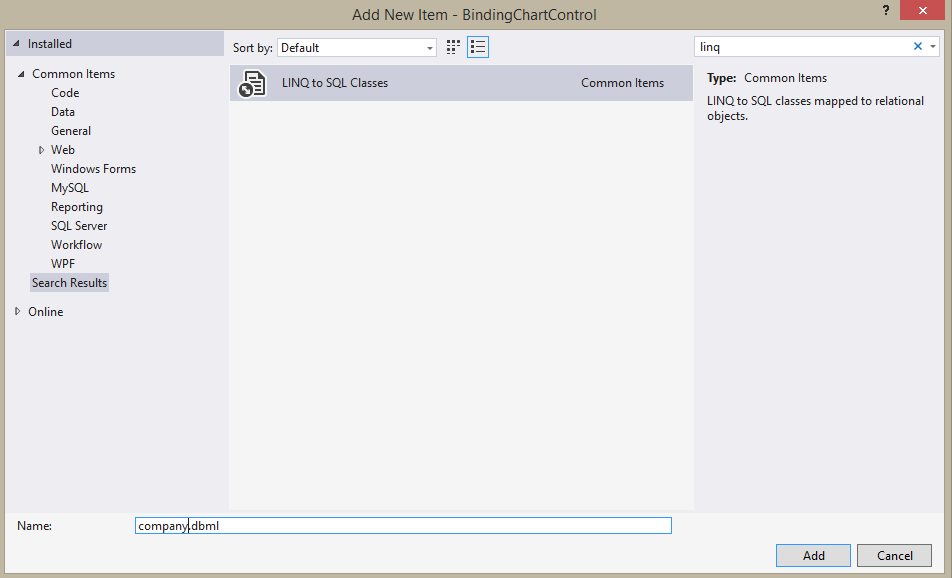
Add LINQ to SQL Class
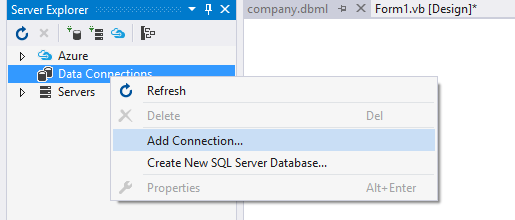
Connect to the Database
From the Server Explorer, we need to add a new connection. If there is already made the database, we can go ahead and use it by clicking on the Add Connection Button. To create a new database instance of SQL Server, we need to click on that Create New SQL Server Database option.
Connect to Database Server
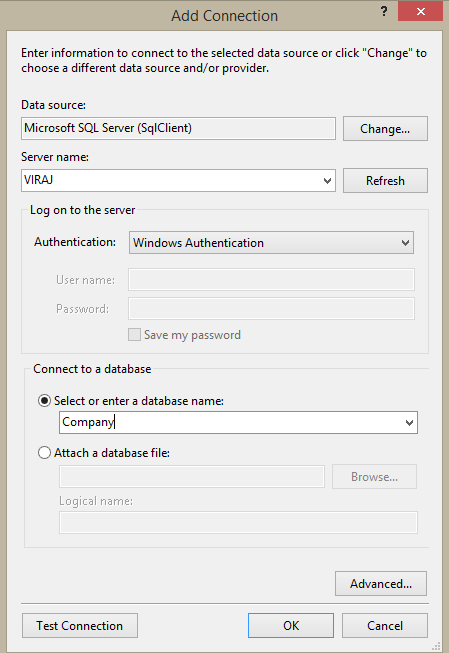
Select the Database
After creating the database, go to the form view by double clicking on the form window we created which contain the chart. Create a new method to execute the binding of the data. Inside the method, create an instance from the SQLConnection and SQLCommand which is used in fetching the data from the SQL Server. One thing to notice is that we are fetching data from the database using the LINQ.
So far we have created a database with name “Company” and in that database, we have a table called Employee, which holds some amount of data respect to each person.
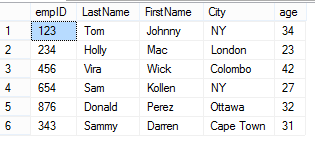
Data View
Bind the Data to the Chart Control
Now let’s move on to the most interesting part: coding! This can be even added inside the form_load method wherein initializing the form, the chart will be bound with the data from the database.
‘create and initialize connection variables
  Dim connection As New SqlConnection
  Dim command As New SqlCommand

 'connect with the database
  connection.ConnectionString = ConfigurationManager.ConnectionStrings["Company"]
                                .ToString()
  command.Connection = connection;

 'retrieve data from the database
  Dim fieldataSet As String = "SELECT COUNT(City) AS City, age AS Age FROM Employee
                              group by age"

  Dim empData As New SqlDataAdapter(fieldataSet, connection)
  Dim dataSet As New DataSet
  Dim newCommand As New SqlCommand(fieldataSet, connection)

 'opening the database connection and filling Employee data to the dataset object
  connection.Open()
  empData.Fill(dataSet, "Employee")
  connection.Close()

 'bind the data to the chart
  Chart1.DataSource = dataSet.Tables("Employee")
  Dim Series1 As Series = Chart1.Series("Series1")
  Series1.Name = "CityLimits"
  Chart1.Series(Series1.Name).XValueMember = "Age" ' assigning age column to x axis
  Chart1.Series(Series1.Name).YValueMembers = "City" ' assigning city count to y axis

  Chart1.Size = New System.Drawing.Size(800, 300) ' resizing the chart size
After querying the database, the result will be stored in the SQL Adapter instance. Later, that instance is used to fill the dataset instance we created using the DataSet class. By default, the name of the chart is Chart1 and we haven’t changed any properties of it as I mentioned earlier. Since our dataset is filled with the employee data, we have bound it to the chart variable using Chart1.DataSource clause. Next, we have set the series names which takes the x-axis and y-axis. From our query, we set the Age as the x-axis and City count as the y-axis. It is important to set the axis names with the names you used for the columns in the query.
Finally, binding all the data to the chart, we can change a few properties of it. In this case, I have increased the size of the chart from default size to a more custom size for viewing purposes. Likewise, we can change the color of the chart, the position of the chart, the pattern of the chart etc.
Related Articles
Comments